Electoral College in India
This document simulates the US’ Electoral College, the system used to elect the President, in India and how it would pan out. The data used is of the 2019 General Election which elected Narendra Modi to power. With the Electoral College, Modi would be re-elected with a large margin.
Process
The Electoral College is a system used in various countries to choose a President. This document focuses on the US implementation, which is the most widely-known. In this system, each state has a set number of votes, and all these votes go to the party which gets most votes. The disadvantage of this is explained in detail in the “Results” section. There is also another process to find out how many votes each state gets, that’s given below.
- The Electoral College allots votes to each state somewhat proportional to their population
- Each State gets a number of votes according to their population
- They also get an additional 2 votes, which comes from their representatives in the Senate
- In each state, the party with most votes gets all representatives in the College, regardless of their winning margin
Votes for a State = Proportional Votes + 2 Senate VotesNote: Because all federal divisions in the US are states and have the same rights, they all have 2 seats in the Senate. In India, there are 8 UTs which need separate rules to reflect their lower authority. Even if the US Senate was used, they would not have any Senators and thus would have only their Proportional Votes. This document adjusts for that by removing the two Senate votes.
Allotment
The seats allotted to each state and Union Territory (as of 2019, 36 total divisions) is as follows:
| State | Population | Number |
|---|---|---|
| Uttar Pradesh | 237882725 | 297 |
| Bihar | 124799926 | 157 |
| Maharashtra | 123144223 | 155 |
| West Bengal | 99609303 | 126 |
| Madhya Pradesh | 85358965 | 108 |
| Rajasthan | 81032689 | 103 |
| Tamil Nadu | 77841267 | 99 |
| Karnataka | 67562686 | 86 |
| Gujarat | 63872399 | 82 |
| Andhra Pradesh | 53903393 | 69 |
| Odisha | 46356334 | 60 |
| Telangana | 39362732 | 51 |
| Jharkhand | 38593948 | 50 |
| Kerala | 35699443 | 47 |
| Assam | 35607039 | 47 |
| Punjab | 30141373 | 40 |
| Chhattisgarh | 29436231 | 39 |
| Haryana | 28204692 | 37 |
| NCT OF Delhi | 18710922 | 26 |
| Jammu & Kashmir | 13895343 | 20 |
| Uttarakhand | 11250858 | 16 |
| Himachal Pradesh | 7451955 | 12 |
| Tripura | 4169794 | 8 |
| Meghalaya | 3366710 | 7 |
| Manipur | 3091545 | 6 |
| Nagaland | 2249695 | 5 |
| Goa | 1586250 | 4 |
| Arunachal Pradesh | 1570458 | 4 |
| Puducherry | 1413542 | 2 |
| Mizoram | 1239244 | 4 |
| Chandigarh | 1158473 | 2 |
| Sikkim | 690251 | 3 |
| Daman & Diu | 242911 | 1 |
| Dadra & Nagar Haveli | 372813 | 1 |
| Andaman & Nicobar Islands | 417036 | 1 |
| Lakshadweep | 73183 | 1 |
In the US, each vote ranges from representing almost 700,000 people in California to about 200,000 people in Wyoming.

In India, a vote in the Electoral College would go from representing 800,000 people in UP to 230,000 in Sikkim, which is almost the exact same range as in the US. This is important since it determines how much relative power a citizen in, for example, Sikkim has compared to a voter in Bihar. The Sikkim voter has a higher influence over the result of the election.
This is intentional and done to give more power to smaller states and ensure that large states are atleast somewhat limited over their influence over the elections.
The outlier is Lakshadweep, which has just 73,183 people for its vote. This is due to its population being much, much smaller than any other division in the country.
Results
Before viewing results, it must be noted that the Electoral College is not a pure reflection of popular opinion. The College makes it much harder for parties to win votes without coalitions, and benefits regional parties. Regional disparities within states are all but ignored. In the Westminster system, for example, Nagpur (MH) can vote INC and Mumbai (also MH) BJP and both would be represented by their chosen party. However, with the Electoral College, BJP would win all of Maharashtra’s votes since Mumbai has a much larger population, and INC voters in Nagpur would not count towards Maharashtra’s votes for PM.
Note: In the US, Maine and Nebraska proportionally distribute their votes, but all other states use the same winner-takes-all system. This has led to much criticism for the system within the country, especially from people who don’t vote the same way as their state does, since their vote doesn’t count nearly as much as it might.
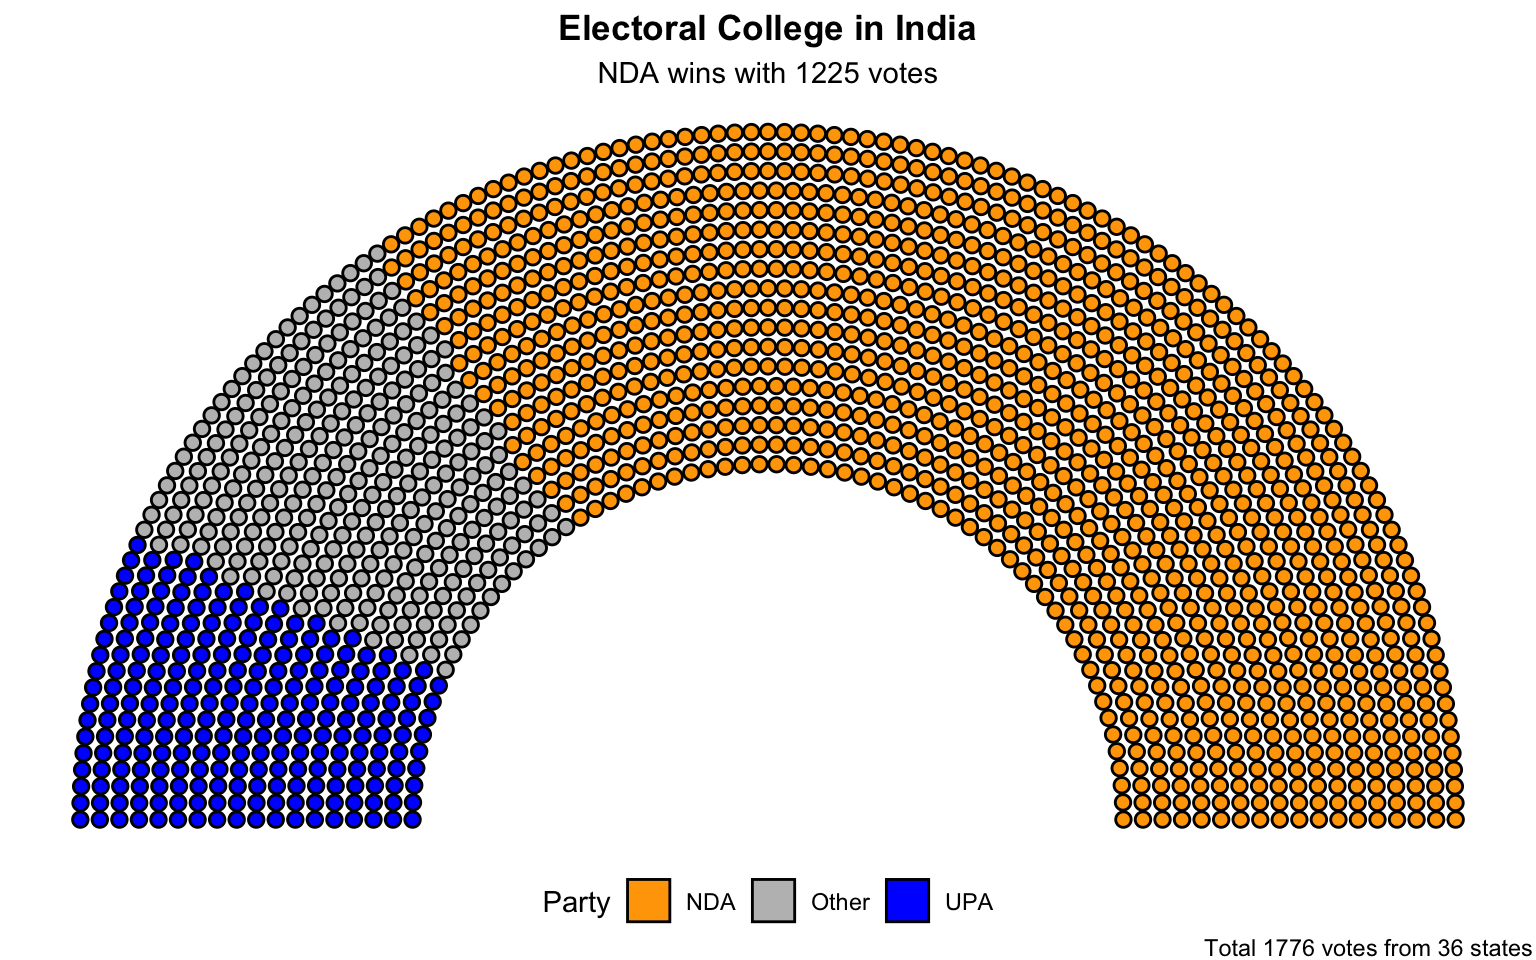
| Party | Votes | Percent |
|---|---|---|
| NDA | 1225 | 69.0 |
| Other | 307 | 17.3 |
| UPA | 244 | 13.7 |
The results of the Electoral College if it were used in the 2019 General Elections are very clear. It awards the NDA Alliance with 1225 of 1776 votes. The UPA would secure 244 votes, and other parties including TRS (Telangana), AITC (Bengal) and more would hold 307 seats. Detailed results for each state are also given below.
| State | Party | Votes |
|---|---|---|
| Andaman & Nicobar Islands | UPA | 95308 |
| Andhra Pradesh | Other | 30739524 |
| Arunachal Pradesh | NDA | 379679 |
| Assam | UPA | 7786757 |
| Bihar | NDA | 21793708 |
| Chandigarh | NDA | 231188 |
| Chhattisgarh | NDA | 6953196 |
| Dadra & Nagar Haveli | Other | 104007 |
| Daman & Diu | NDA | 37597 |
| Goa | NDA | 438413 |
| Gujarat | NDA | 18091275 |
| Haryana | NDA | 7364108 |
| Himachal Pradesh | NDA | 2661281 |
| Jammu & Kashmir | NDA | 1652721 |
| Jharkhand | NDA | 8272264 |
| Karnataka | NDA | 18067804 |
| Kerala | UPA | 9709289 |
| Lakshadweep | UPA | 44879 |
| Madhya Pradesh | NDA | 21423131 |
| Maharashtra | NDA | 27501203 |
| Manipur | NDA | 919891 |
| Meghalaya | UPA | 660114 |
| Mizoram | NDA | 252993 |
| Nagaland | NDA | 500510 |
| NCT OF Delhi | NDA | 4908541 |
| Odisha | Other | 10972815 |
| Puducherry | UPA | 444981 |
| Punjab | UPA | 5532221 |
| Rajasthan | NDA | 19645004 |
| Sikkim | NDA | 350416 |
| Tamil Nadu | UPA | 20253838 |
| Telangana | Other | 8798384 |
| Tripura | NDA | 1055658 |
| Uttar Pradesh | NDA | 42896642 |
| Uttarakhand | NDA | 2954833 |
| West Bengal | Other | 26650275 |
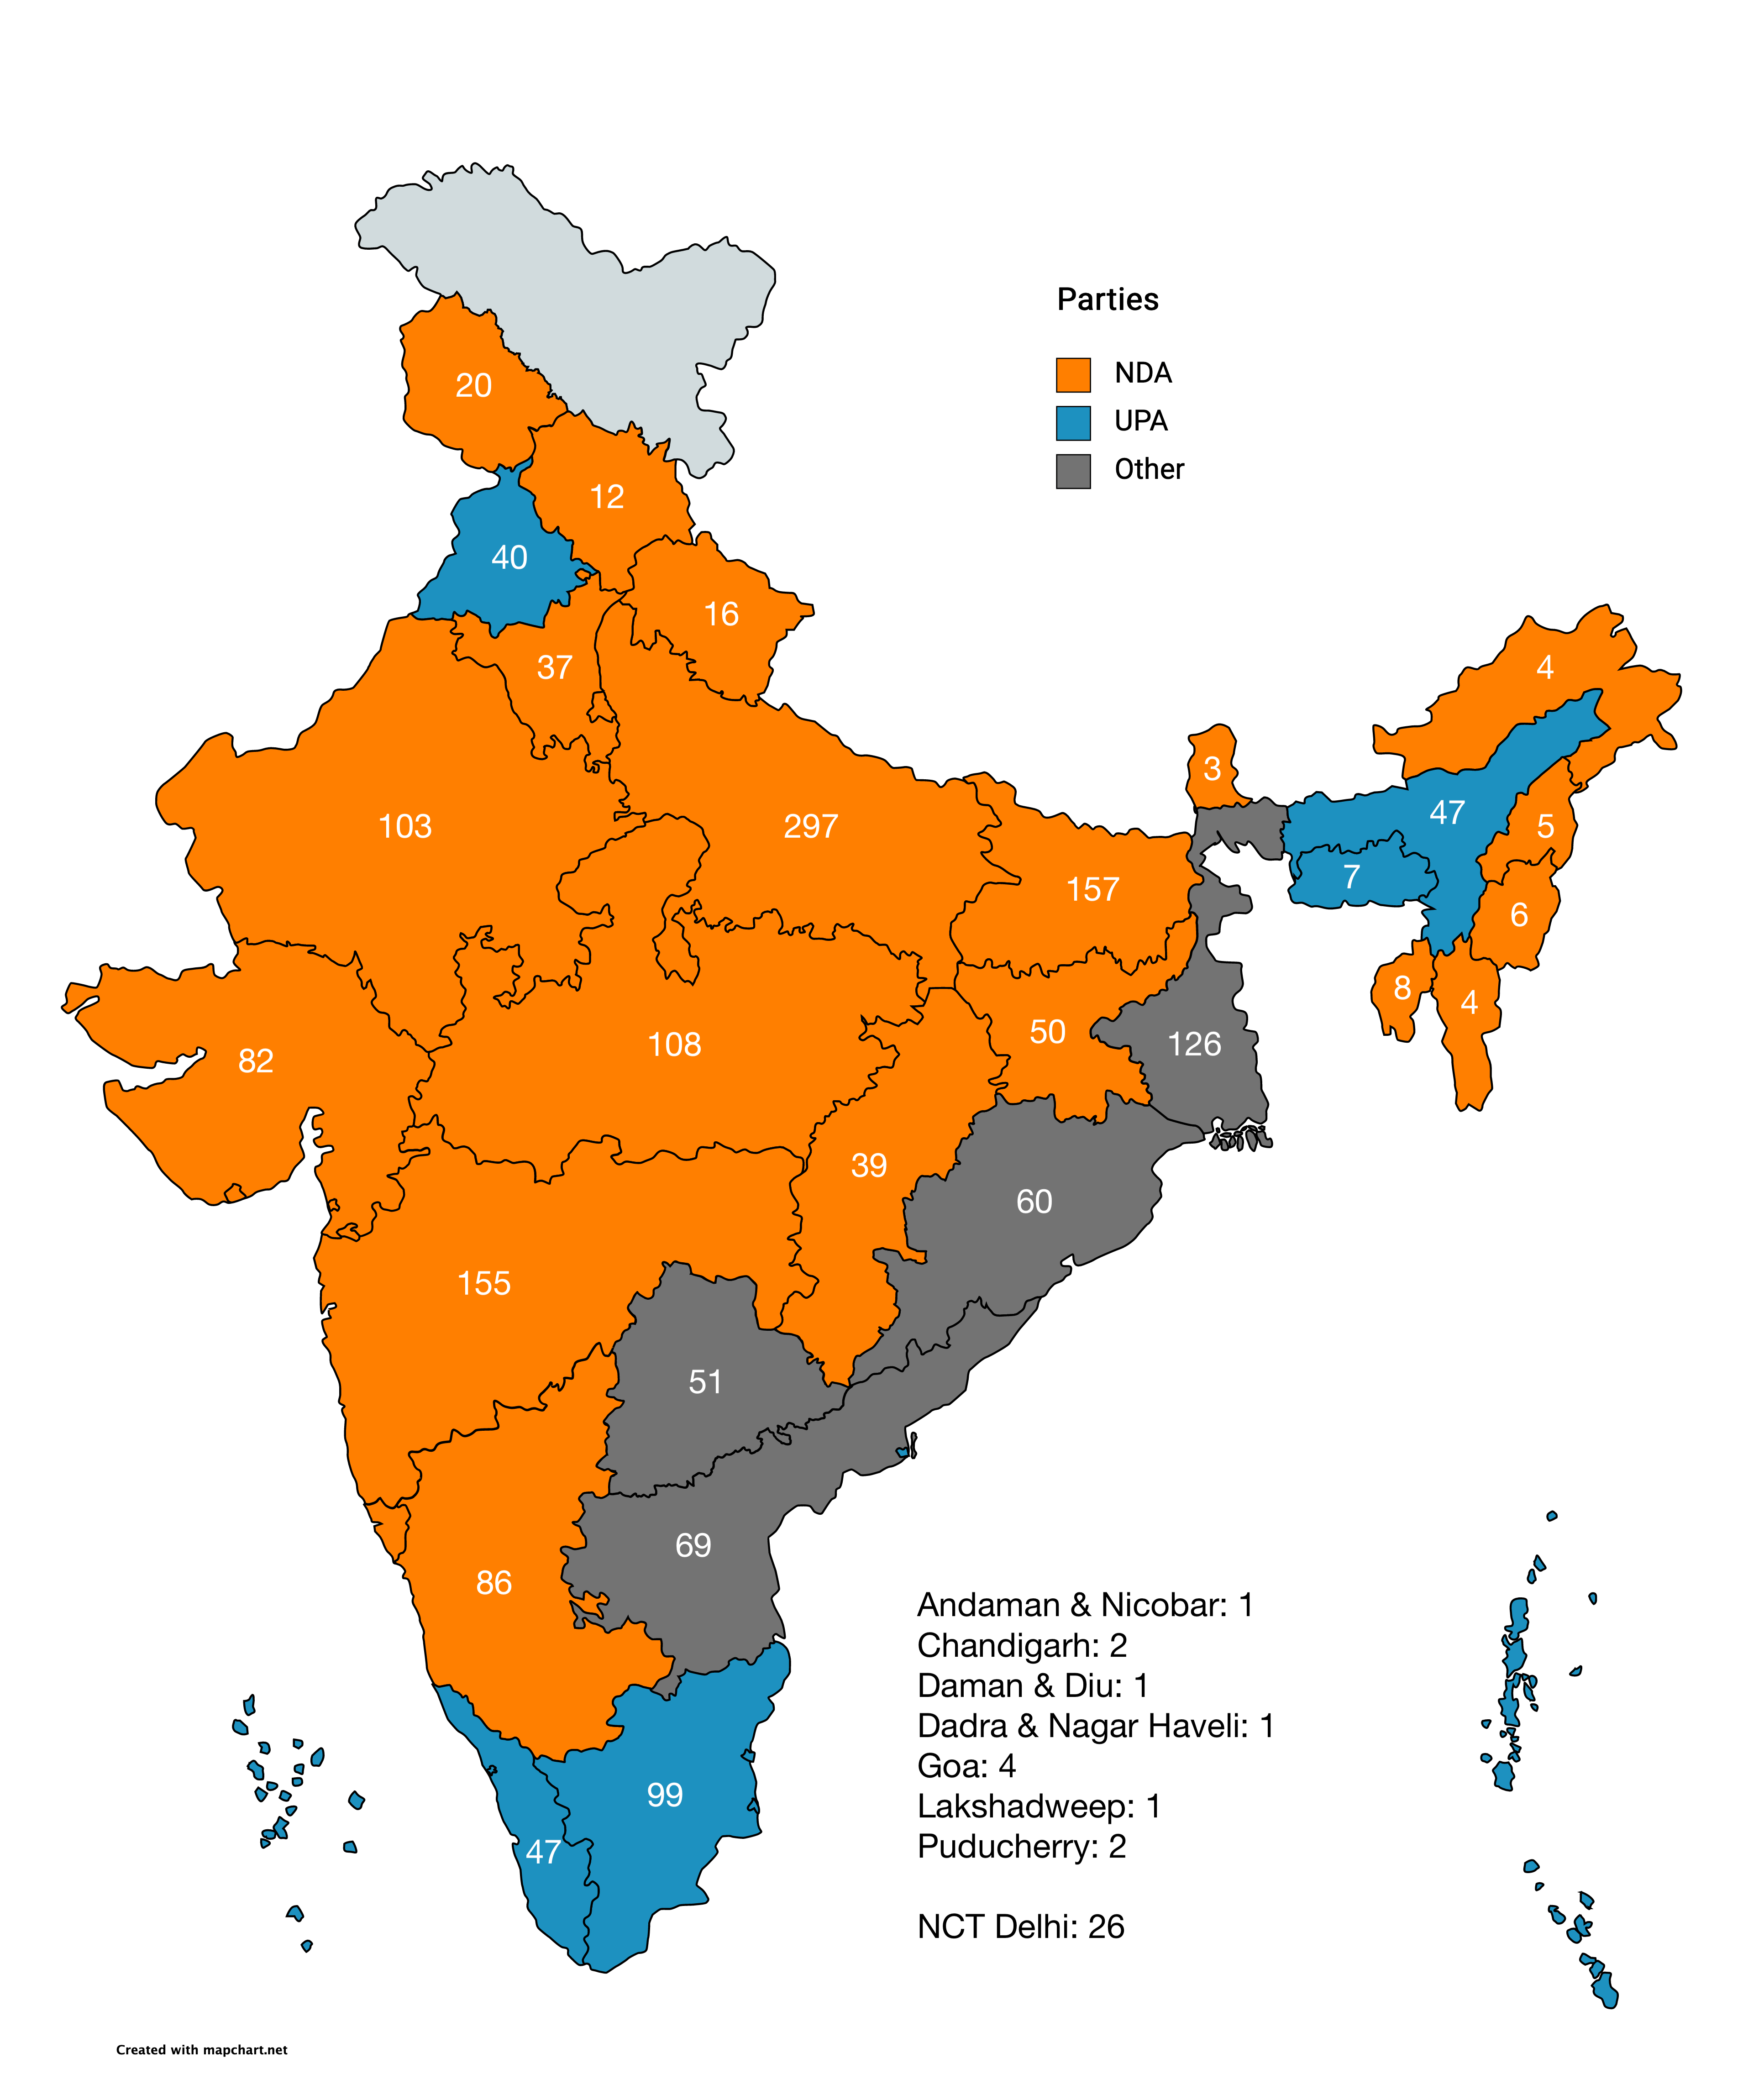
States of India with winning party and number of votes
Notes
Alliance information from various Wikipedia pages. Some minor parties may not be accounted for properly, resulting in discrepancies from ECI figures. Unfortunately, I could not find any authoritative source of information about this, and thus, some parties may not be included in the figures.
However, the outcomes for all states except Sikkim will not change; only the number of votes may change.
In the state of Sikkim, the SKM party has been considered part of the NDA despite not having an official alliance. This is because they were close to forming an alliance, and after the general election, formed a coalition with the BJP and have since been part of the NDA. I’ve presumed that they would, if given the chance, vote for a BJP executive.Election data is from ECI.gov. Link
States and their population figures obtained from StatisticsTimes. Link
Graph and site generated with R and RMarkdown.
US figures from Wikipedia and various other sources